100 Years of Nova Scotian Weather in an Interactive Online Viz
This is my latest Tableau "viz" as I teach myself the software. It's 100 years of weather in eight places in Nova Scotia:
- Halifax
- Liverpool
- Yarmouth
- Greenwood
- Halifax Airport
- Amherst
- Antigonish
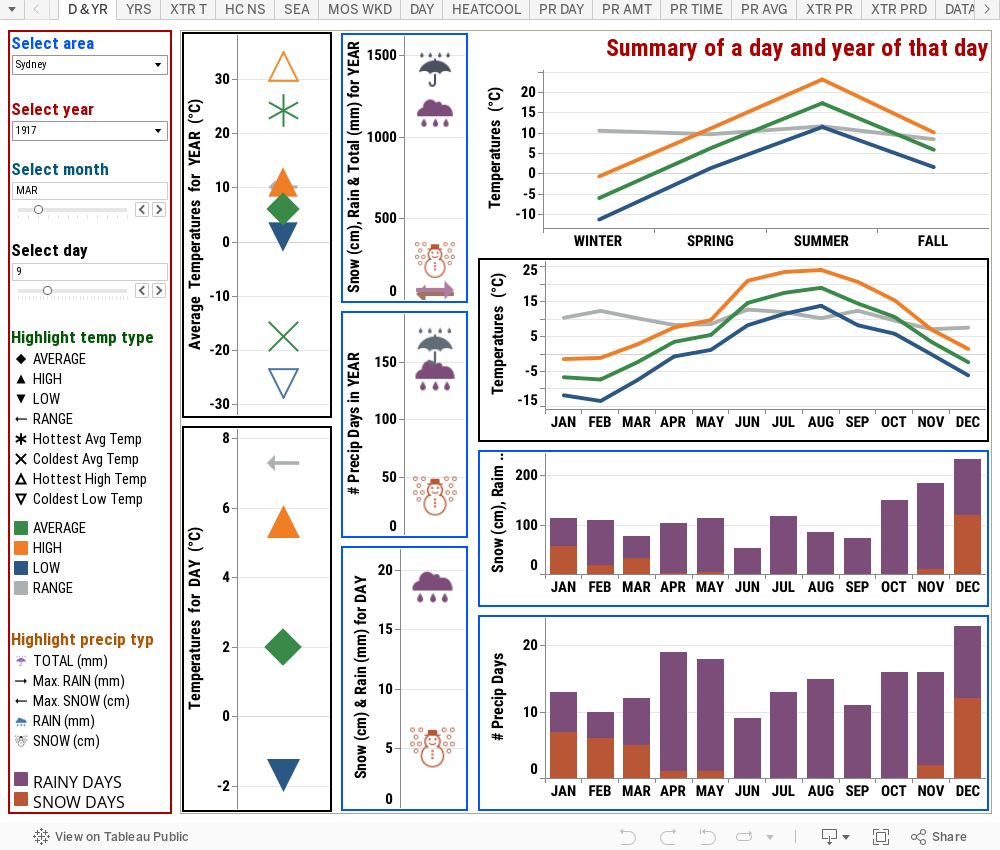
- Sydney
Getting the data for this nearly killed me as it was generally pretty messy and not really aggregated! I have over 1600 files for 8 places at 100 years each! It was messy except for Sydney and Yarmouth. That was why I had them as separate "vizzes" for Sydney and Yarmouth, each with a longer time range. In doing so, I got to test out the data substitution nature of Tableau for when I need to swap data to make similar vizzes with slightly different data sets, or on a common theme but not desired to be together. The reason for that could very well be to keep things manageable as with the individual place weather vizzes, you never have to worry about the area you're looking at or selecting. You can just focus on the weather.
I did Halifax just because so many Nova Scotians lived here I didn't want to leave us out, but that was a pretty messy data set.
I did Halifax just because so many Nova Scotians lived here I didn't want to leave us out, but that was a pretty messy data set.


Comments
Post a Comment