How do YOU Physically Measure Up to Canadians?
You can find average values of various populations' height, weight and such, but that doesn't give you any idea about the distribution of those measures in the population. If you were to compare yourself to them, the best you could do is to see if you were higher or lower than the average (mean, possibly median if given). You could also do the difference in your measurement to the average, but doesn't give you much of an idea what portion of the population might lie between you and that average.
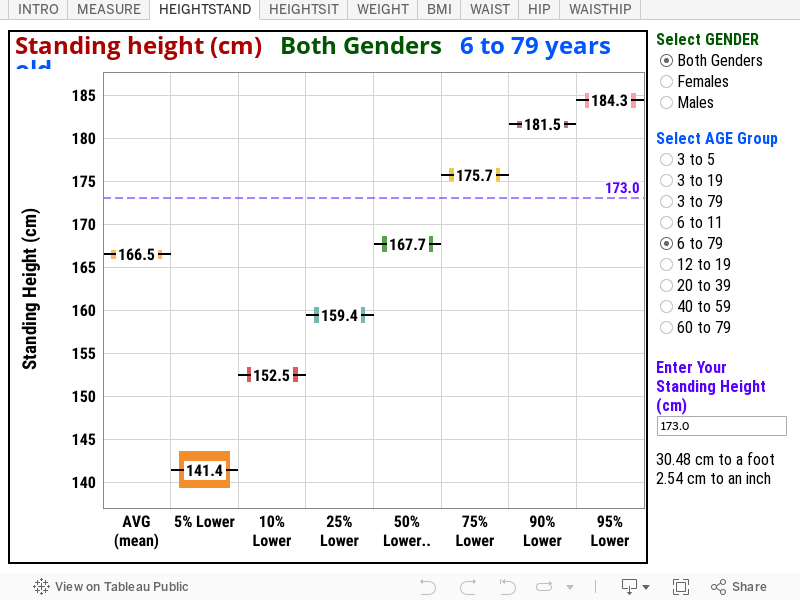
The Canadian Health Measures Survey (CHMS) measures and surveys thousands of Canadians on some physical measures and health determinants, and reports it in various percentiles of the Canadian population. That is, in addition to an average (mean), they also give you values that have 5% of the population below it, as well as 10%, 25%, 50% (median), 75%, 90% and 95% of Canadians below it, with some small margin of error. The CHMS also did it for various demographics of gender and age, so you can compare yourself to people who are more like you in age and gender. That's what I visualized in the dashboards shown below. You can just look at them to see how Canadians distribute out in various demographics, or put in your measurement and see roughly where you end up. You can also just "eyeball" it, of course, but nothing is recorded or stored so you don't need to worry about privacy.
The measures I chose are physical measurements considered to be standard health determinant measurements:
- Standing height (cm)
- Sitting height (cm)
- Weight (kg)
- Body Mass Index (BMI)
- Waist circumference (cm)
- Hip circumference (cm)
- Waist to Hip Ratio (cm)
You should have a calculator of some form while doing this. The Tableau software I used to create this either doesn't have features to calculate from inputs, or they're not very intuitive to figure out, and not easy to find in searches, either. There is no time limit so don't rush through it. Just take your time to do it right. There are measuring instructions.
You can also see at what heights various portions of the populations are shorter than, and conversely subtracted from 100, taller than. So if 75% of the population
That aside, if you put in your measurements, you can see between which two percentiles' values they fall. If your height were 173 cm as the default value shown, then you'd be taller than at least half the population between 6 to 79 years, but not 75% of the population. Eyeballing here would give you reasonably fair accuracy if you did it well, like linear interpolation. It looks to be about 2/3 of the way up from 50 to 75 percentile. That's 2/3 of 25 points or 16 percentile. Add that on to the 50 percentile you're taller than and you can guess you're taller than about 66% or 2/3 of Canadians.
Change the demographics to women 6 to 79 and you're taller than 95% of them! Of course, that includes females who are not yet full grown adults. But take the 20-39 years old female group (before they start shrinking due to old age), and you're still taller than pretty much 95% of that demographic. That shouldn't surprise anybody, though.
See how that works?
Statistics Canada, which provided the tables for this in CANSIM table 117-0001, did not have age groups like 18 and above, which I wish they did.
Comparing your ENTIRE self
You can then click on the various tabs and do the same things with all the other measurements given.
Record roughly where you fall on each measurement and see if there were any "anomalies". For example. you might fall between 60-70 percentile for everything but sitting height, where you're lower because well, you might be "all legs". Don't look at any of it in the judgmental sense, though, but rather as FYI to better understand your body against a demographic.
For Non-Canadians
I only have values for Canadians from this survey, so if you were from another country, you could only compare yourselves to us, not your fellow citizens. However, we're like the nicest people on the planet so comparing yourself to us.National or jurisdictional comparisons
What might be funner is to get some average values for your country's populations (state, continent, country bloc, or any other "jurisdiction") and compare them to the Canadian values. Just make sure the demographics are approximately the same, especially the age groups, for an accurate and "fair" comparison.Feel free to share results
No measurements entered are recorded, but if you care to share or summarize your results for the fun of it, please feel free to share in the comments! They will not be used for anything. Just for the record you left them there.


Comments
Post a Comment